Inventory forecast
By means of inventory forecasts, the future incoming and outgoing inventory movements (receipts, outbound orders, production orders...) can be aggregated for particular items. This way expected future stock breaks (emergence of shortages based on the known data) can be identified.
An overview can be retrieved of the future planned inventory movements in a list or a graph, and a number of data concerning stock breaks can be consulted.
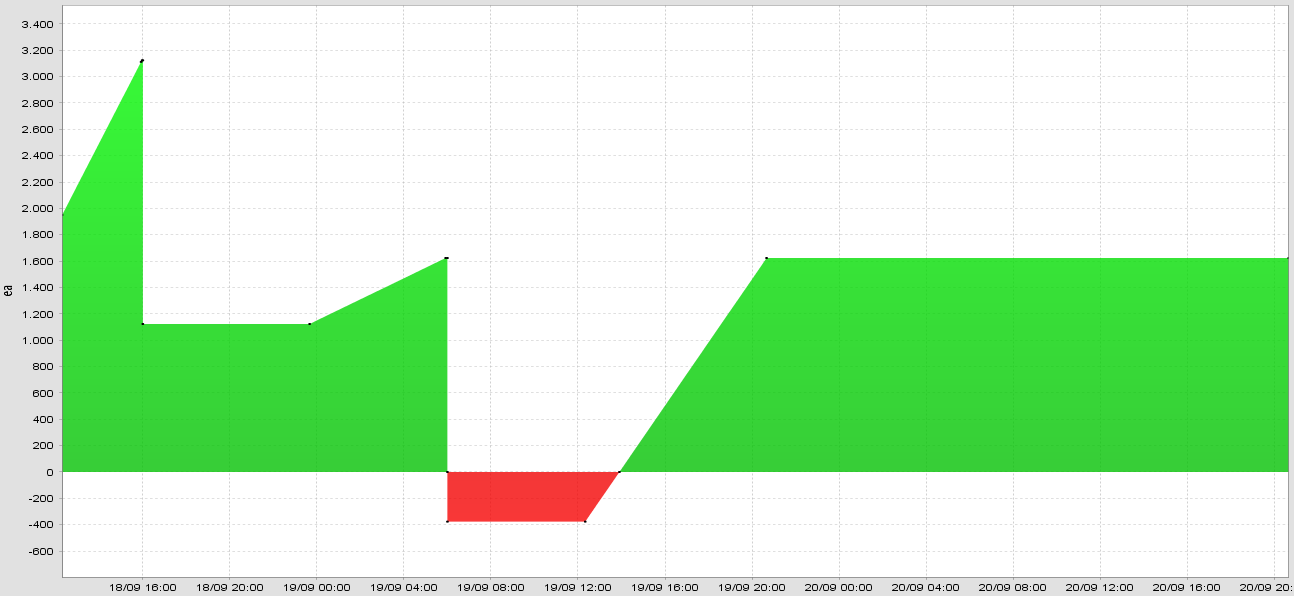
On the inventory graph, the quantity of items in inventory is represented on the Y-axis, and the time on the X-axis.
- Outbound is represented by a vertical line (descending, inventory drops immediately)
- Receipt is represented by a vertical line (increasing, inventory rises immediately)
- Planned consumption of raw materials during production is represented by a downward trend (inventory drops gradually)
- Planned production of end items and/or intermediate items is represented by an upward trend (inventory rises gradually)
When the planned inventory goes below 0 (based on the known data), the graph will be colored red until the anticipated quantity exceeds 0 again. The stock break is the actual moment the available inventory would go below 0.