Data aggregation
Product data are collected via trending. Data aggregation creates a brief summary of these data. These data can be represented visually and can be used for statistical analyses. Various parameters of machines, jobs over a specific period can be viewed.
The summaries can be according to 2 calculation types:
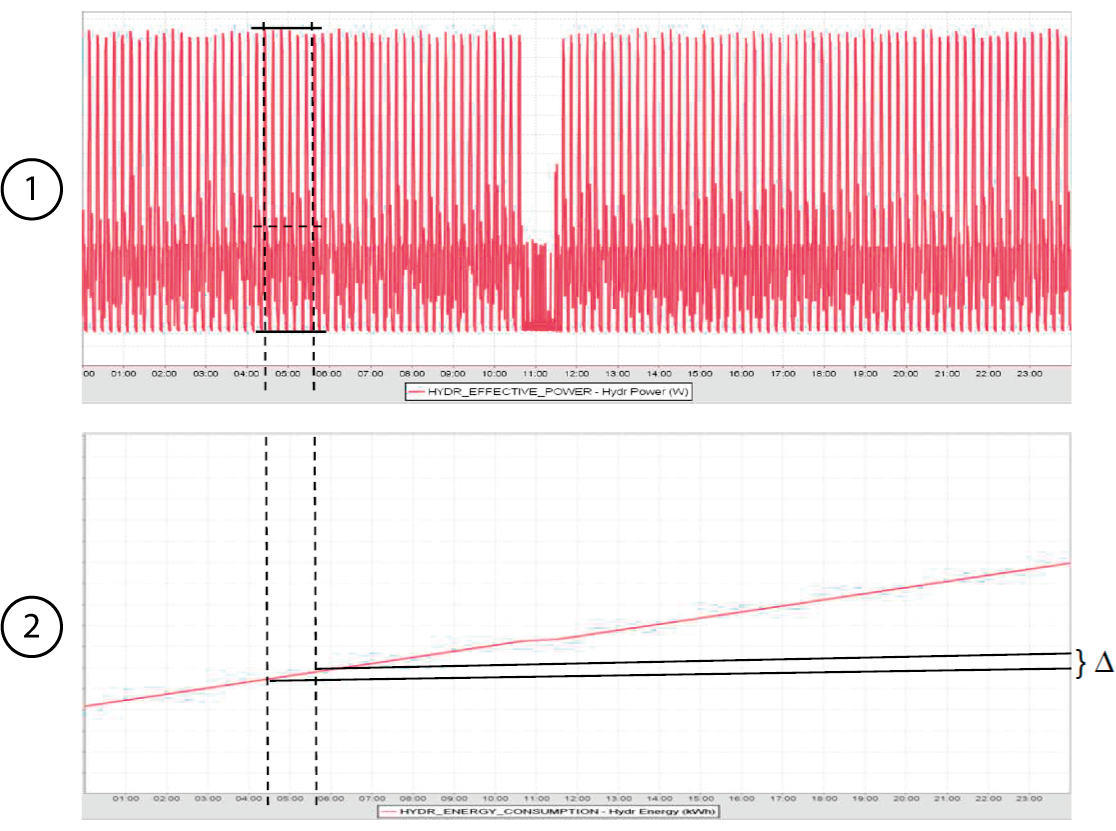
- Average: (1) Values over a specific period are summarized as minimum, maximum, average of all data within the period to be used. For example: the temperature of a machine.
- Total: (2) Totals are displayed as a total by determining the difference between the last value within the period and the first value within the period. For example: the total energy consumption. To determine the energy consumption over an hour, the difference is determined between the energy consumption at 2 pm and the energy consumption at 1 pm.
For example: the electricity consumption of a machine during the early shift, the electricity consumption of the machine during the setup of a job.
You must configure data aggregation sets in order to be able to summarize data. The data aggregation sets contain aggregations. In the aggregations you specify how the data must be collected by setting the period and specifying whether the aggregation must also be made for each status and/or each job.
In Objective there are 6 different periods for summarizing data: hour, day, week, shift, job and relative. The first 5 periods (hour, day, week, shift and job) are absolute periods, where Objective creates a new summary each time the period is exceeded. For example, for the chosen period of one hour, Objective will create a new summary each time a new hour starts. Relative is a dynamic period where the data from the last X hour are summarized. For example, the electricity consumption of a machine during the last hour.
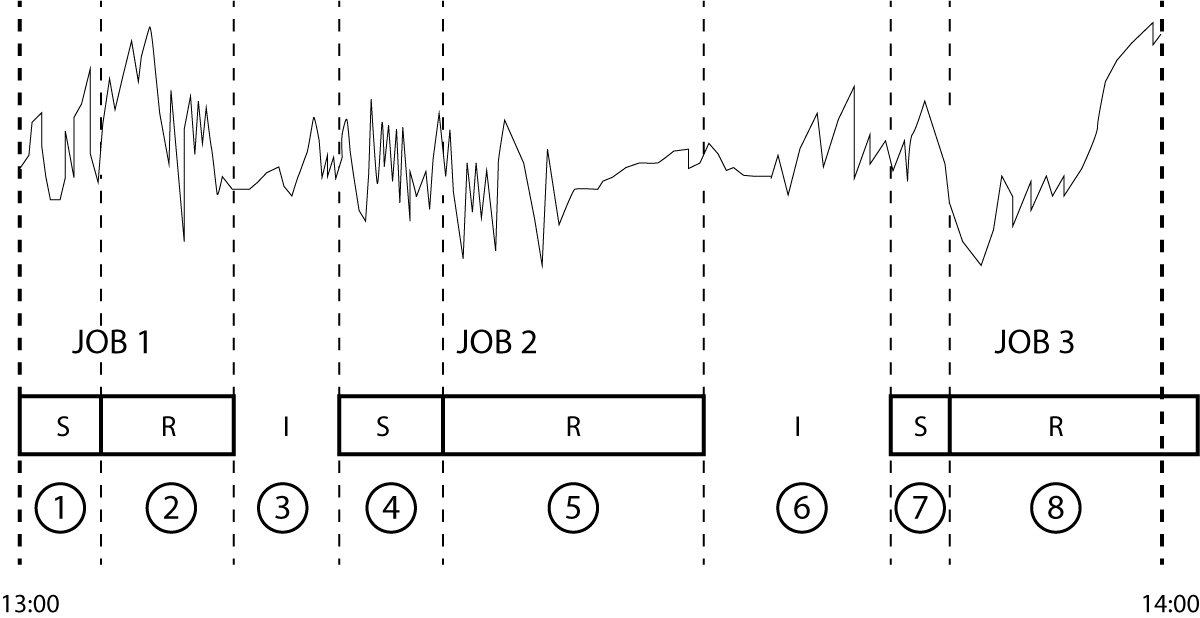
The aggregation is according to hour type. The table below shows what parts of a summary are created according to the options checked.
| State Based | Job Based | Summary |
|---|---|---|
| 0 | 0 |
1 summary: 1 + 2 +3 + 4 + 5 +6 + 7 + 8 |
| X | 0 |
3 summaries: Status IDLE (I): 3 + 6 Status Setup (S): 1 + 4 +7 Status Production (R): 2 + 5 + 8 |
| 0 | X |
3 summaries: JOB 1: 1 + 2 JOB 2: 4 + 5 JOB 3: 7 + 8 |
| X | X |
7 summaries: No job & Status IDLE (I): 3 + 6 JOB 1 & S: 1 JOB 1 & R: 2 JOB 2 & S: 4 JOB 2 & R: 5 JOB 3 & S: 7 JOB 3 & R: 8 |